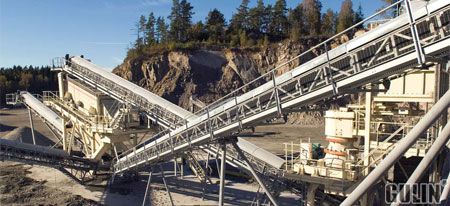
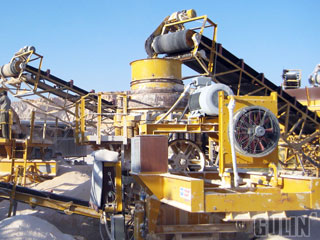
The importance of wear part costs In the typical quarrying operation shown in Figure 1, the crushing and screening operations indicated by a yellow circle represent about 40% of total costs. A breakdown of these costs is shown in Figure 2.
One of main components in the crushing and screening process is a cone crusher, and a typical cost distribution for this element is shown in Figure 3. The calculation reported here employs a typical average case with an Abrasion Index of 0.5g/ton which translates into four sets of wear parts each year.

While the message in figures 2 and 3 is the relevance of wear part costs, it should be noted that costs are not the whole story; plant yield is also relevant. Higher costs can be justified if the resulting yield corresponds to higher levels of sales revenue.
Less waste, higher profit
An important bonus resulting from a better yield of aggregate is reduced waste, and as this usually consists of fine material there will also be less dust. Improved yield also means that less energy is required per ton of end product because energy is not consumed in producing the waste. A good rule of thumb is that a 1% improvement in yield corresponds to a 4% improvement in operating profit. Reducing the amount of dust generated also makes the working environment healthier.
In basic terms, wear parts in crushers are the only components needing replacement as all other elements either support the wear parts and/or move them to produce the crushing action. Matching new wear parts to the process is an important part of keeping production as constant as possible over their entire lifetime. As well as having a strong influence on production and yield of the desired fractions, wear parts in crushers also have an immediate connection to direct operational costs, levels of sales revenue and environmental factors. Extensive research and the employment of modern calculation tools mean it is now possible to optimize crusher performance through accurate wear part design and kinematics.
Latest models use selection and breakage functions
The first models for predicting jaw and gyratory crusher performance were published in the 1950s. In these, crusher capacity was estimated by calculating the flow of material in the crushing chamber. Subsequent models use equations of motion and take into account selection and breakage functions derived from laboratory tests and verified in practice.
The model developed by Gulin® Minerals research is based on mechanical principles and predicts size reduction by employing selection and breakage functions. These functions are derived in empirical form through extensive and on-going laboratory tests that include both single-particle and particle-layer compression tests on different materials. Simulation techniques are fine-tuned to a high level of accuracy using the results from hundreds of full-scale crushing tests carried out in-house.
Two categories of input parameter
Input parameters for the simulation program are divided into two categories: crusher and feed material. The crusher parameters are the crushing chamber geometry, crusher model, crusher setting, crusher stroke and the eccentric speed. Information on material characteristics – feed size distribution, feed material crushability and feed specific gravity – and the flow model is then used as input for the size-reduction model.
Outputs of the simulation program are product grading, throughput capacity, power draw, material density in the crushing chamber, an estimation of the wear profile in the cavity, crushing pressure / force, and key values for estimating product quality. Figure 4 shows some of these results. Although practical experience is necessary when interpreting them, the calculated results quickly provide an idea of how crusher and cavity performance can be optimized.
Assessing crusher performance – case study

Rock crusher
Rock crusher performance is a function of the size reduction achieved, throughput capacity, energy consumption and quality (i.e. grading and particle shape). The parameters used in assessing performance include the characteristics of processed rock material, feed material size distribution and feed material characteristics such as moisture levels etc. Crusher parameters assessed include crusher kinematics and crushing chamber geometry.
Significant improvements in aggregate plant performance in a large Scandinavian quarry have been achieved through use of the Gulin® Minerals simulation model. Production at the quarry consists of several size fractions, two of which were selected for the performance assessment. Size fraction 0/2 is waste material, while market demand for the 5/11.2 mm fraction is good and production of this should therefore be maximized. Before the assessment began, the GP500 crusher was producing size fraction 5/11.2 mm as 15.3% of crusher throughput.
The crusher cavity performance program was used to simulate and analyze this case. Results of the simulation indicated that fine tuning of the crusher offered considerable potential for increasing the proportion of the saleable 5/11.2 mm product and reducing the amount of waste.
Major improvement in overall plant economy
Modifications indicated by the simulation were carried out. Data collected both before and after adjustment of the crusher is shown in Figure 5. As this operator utilizes belt scales, fraction capacity – the compared performance value – is given here as an average value during the lifetime of one set of liners. After removing the influence of feed material, the proportion of saleable 5/11.2 mm was improved by 16%. The proportion of waste material fell by 18%.
The results achieved – a 16% increase in production with basically the same crushing costs – has had a major effect on overall plant economy. Estimates indicate that operating profit has risen by 64%. This supports other studies by Gulin® Minerals which indicate that if plant output increases, costs increase by only a fraction of the extra revenue generated due to better utilization of assets and lower variable costs. The reduction in waste means better yield which is good for business and for the environment. The cost of wear parts per ton of saleable material is also lower.
A true “Win-Win” concept
The example given here shows that significant benefits related to the cost of wear parts and production yields can be achieved by utilizing modern simulation methods and combining these with practical experience. Essential prerequisites are an analysis of current plant/machine performance and an in-depth understanding of how each of the processes being assessed works and how it can be finetuned.
While these calculation tools are clearly of great value in process and plant optimization, there is also another real benefit – optimizing performance supports an environmentally- sustainable future. Improved profitability through environmentally friendlier solutions is a true Win-Win concept that is possible today.

